Housing market shift
House sales in Northern Ireland may have reduced by some 80 per cent over the three months of lockdown.
The Northern Ireland Statistics and Research Agency (NISRA), which helps compile the House Price Index, says that the Covid-19 pandemic had “essentially paused” the housing market from the last week of March at that it expected sales to be greatly reduced by as much as 80 per cent.
Such was the impact of the slowdown that a decision has been taken to suspend the publication of the House Price Index for the usual Q2 of April-June 2020. The housing market in Northern Ireland officially re-opened on 15 June, with the then Minister for Communities announcing a relaxation of strict measures on house moves.
However, in reopening the Department issued extensive guidance which outlined that the easing of restrictions did not represent a return to normality. Instead, more of the housing market transactions will take place online, including initial virtual viewings, and there will be enhanced use of appointment systems and strict infection control.
Northern Ireland was the UK’s second region to re-open its housing market after England, where initial reports are of record levels of activity. Those in Northern Ireland’s housing market have described a ‘pent up demand’ but it is not yet clear whether activity will return to pre-Covid levels or what impact the freeze will have on house prices.
In the weeks prior to the UK announcing lockdown measures on 23 March, the number of transactions in the housing market in Northern Ireland was 19.1 per cent higher than the figure for the same period the previous year. However, evidence of lockdown’s impact can be recognised in the number of sales recorded for the last week of March, almost 50 per cent lower than the initial number recorded for the same week in March 2019.
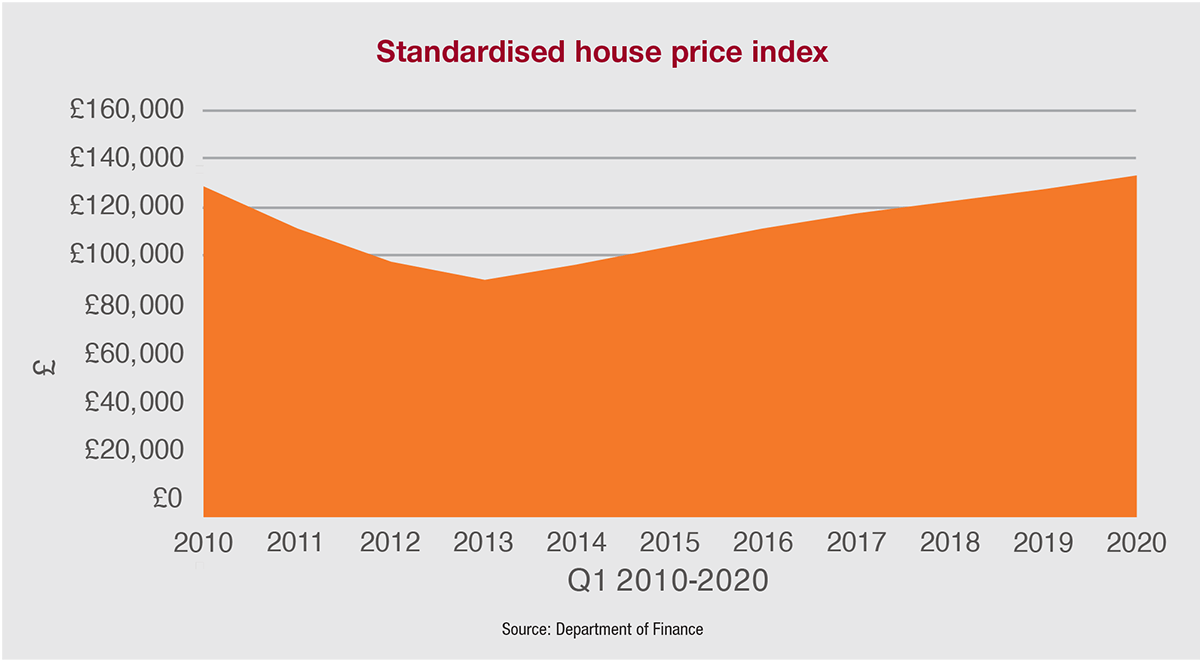
Prior to Covid-19, Northern Ireland’s house prices had been on a steady trend of increase since the lowest point in the last decade of Q1 2013. Then, the standardised house price was £97,428 compared to £140,580, the figure for the first quarter of 2020.
In the early part of the decade, annual decreases in house prices occurred year-on-year for almost four years. Q2 and Q3 of 2012 marked the largest decreases in terms of annual change with both quarters down 12.9 per cent on the same quarters of the previous years. By the end of 2013, this trend started to reverse and there has been a percentage increase in every quarter compared to the previous year ever since. The last months of 2014 marked the largest annual change to date. Compared to Q4 of 2013, the annual percentage change was 8.7 per cent.
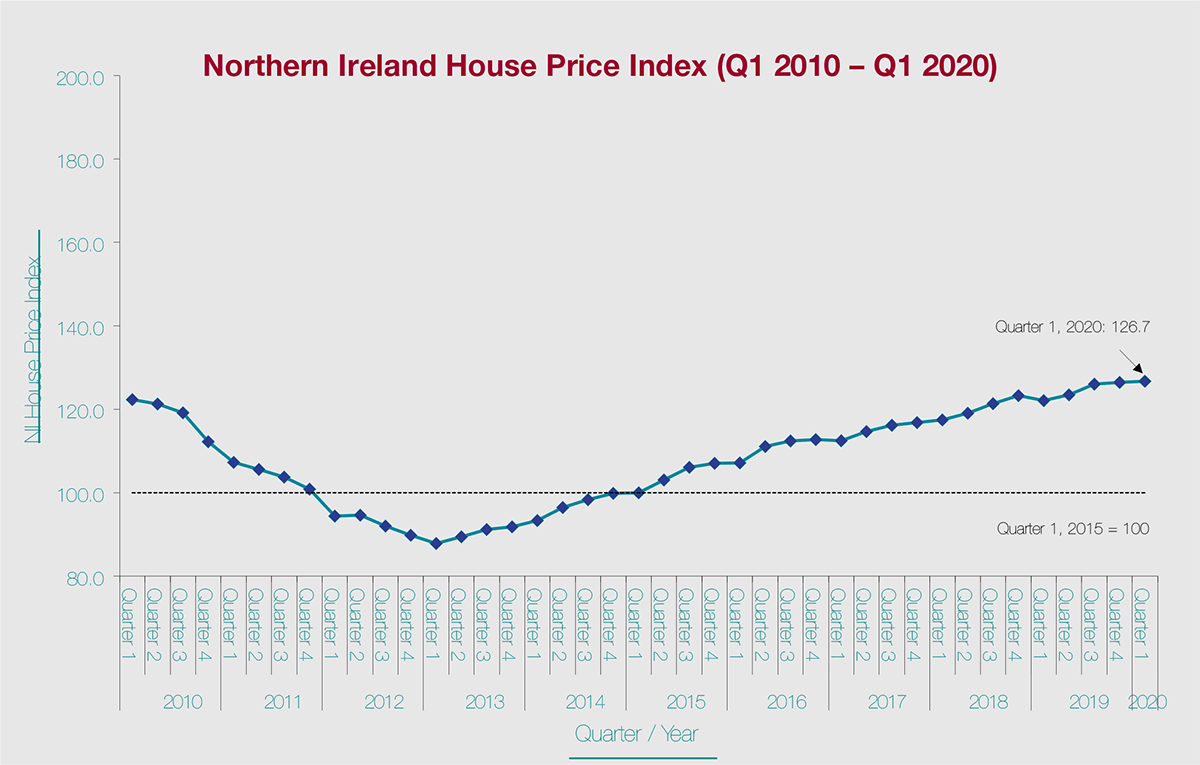
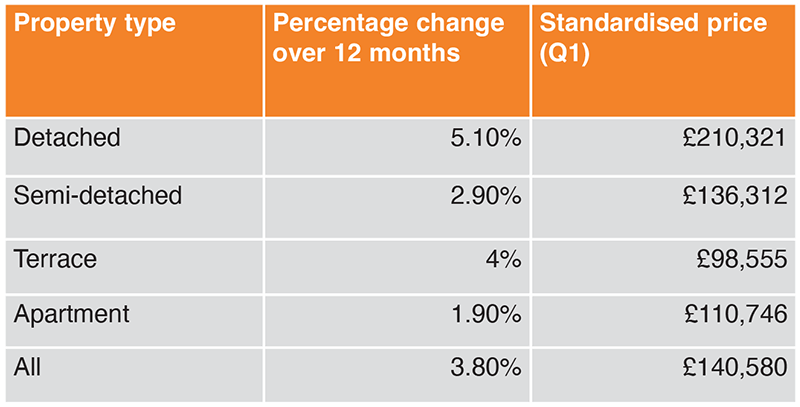
Between Q1 2019 and Q1 2020 the house price index increased by 3.8 per cent meaning that it is now over 26.7 per cent higher than Q1 2015 and 25.6 per cent higher than 2005.
Breaking the figures down into property type, the latest index highlights a percentage increase across all types over the year. Detached properties recognised the largest annual price increase, up over 5 per cent in the first quarter of 2020 compared to the same period for 2019. Terrace dwellings rose in price by 4 per cent on average, while semi-detached properties rose by almost 3 per cent. The smallest percentage increase was in apartments, where the increase was still almost 2 per cent.
Looking at the change over five years, detached properties are 25.2 per cent higher than the first quarter of 2015, semi-detached are currently 24.8 per cent higher than for the same period, terrace properties are 30.6 per cent higher and apartments are 26.7 per cent higher.
There is a slight variation in the price increases between new dwellings and existing resold dwellings. The annual increase in the price of new dwellings was 3.2 per cent, while the price of existing resold dwellings increased by 3.9 per cent since Q1 2019.
A reflection of the shifts in housing prices is reflected in the changes in prices of these two categories of properties over the last decade. From Q1 2005 to Q3 2007, the price index of new dwellings rose by 93.3 per cent and the price for pre-owned dwellings increased by 102.5 per cent for the same period. However, by 2013 both were at their lowest levels over the decade. Since then, the price of new dwellings has increased each quarter and is now 28.2 per cent higher than Q1 2015 and 33.4 per cent higher than Q1 2005. Similarly, the standardised price of resold dwellings is 28.2 per cent higher than Q1 2015 and 33.4 per cent higher than Q1 2005.
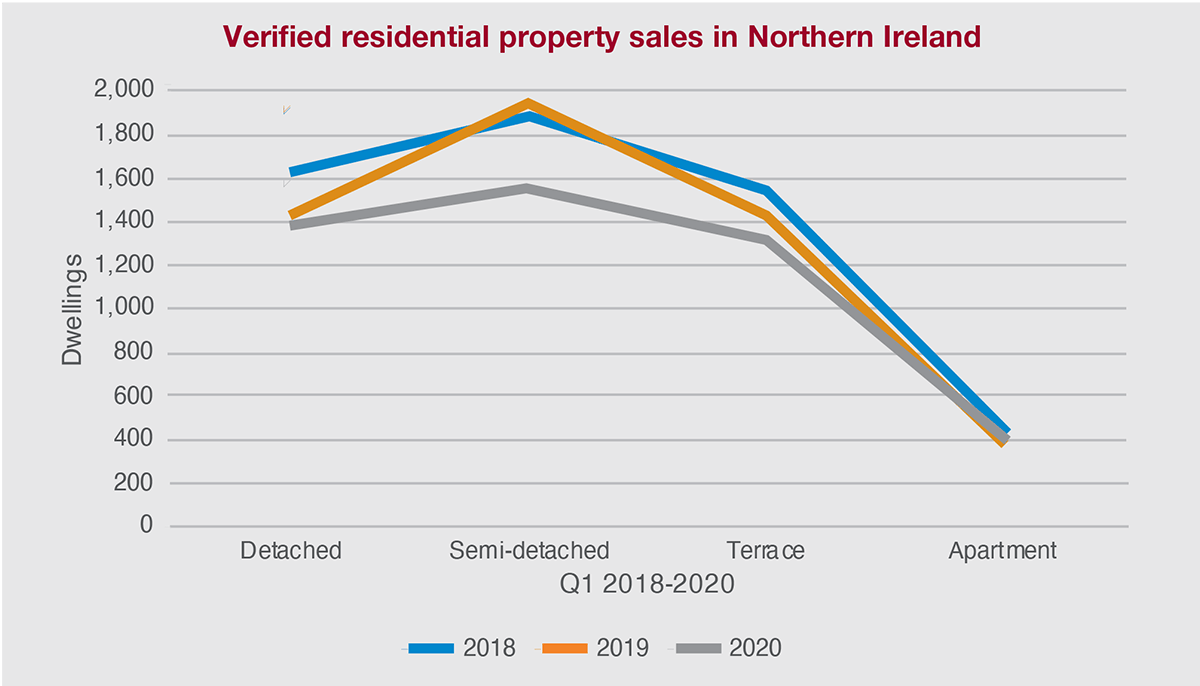
In terms of market activity, the average annual number of sales has risen year-on-year from 11,000 between 2010-2011 to almost 25,000 sales in 2019. Since 2015, semidetached properties are the single largest type of properties sold in Northern Ireland.
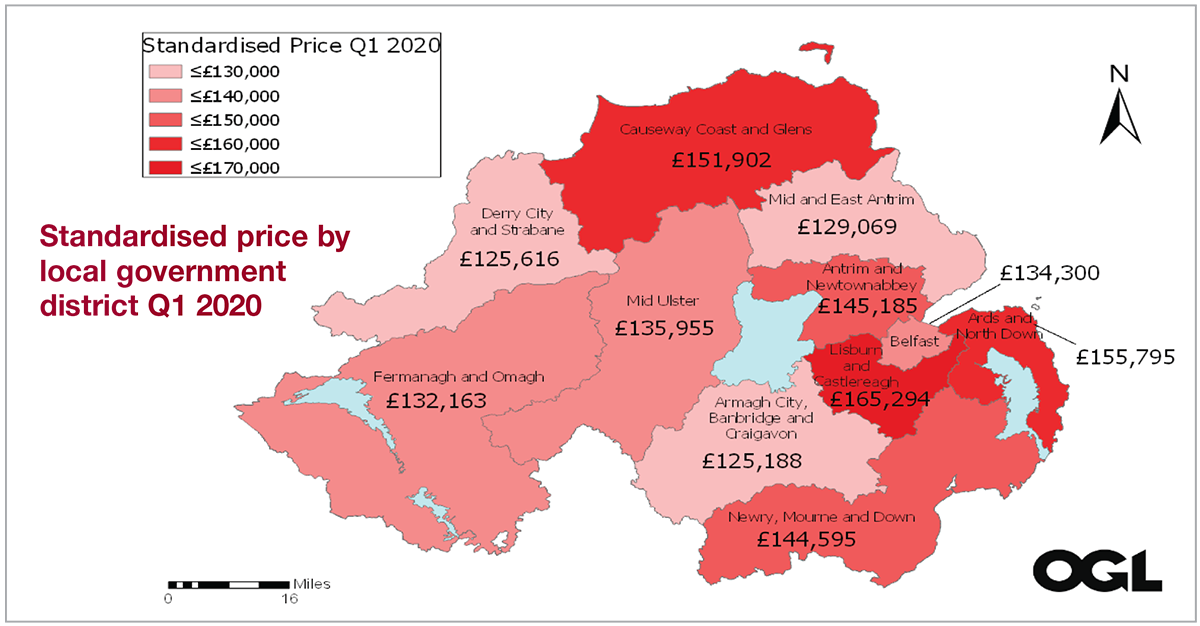
Local Government Districts
At a local level, process in all of Northern Ireland’s local council areas increased over the year but at varying degrees. The lowest increase (2.5 per cent) was in Mid and East Antrim and the highest increase (6 per cent) was in Causeway Coast and Glens.
The standardised price for Northern Ireland as a whole is £140,580 and ranges from £125,188 in Armagh City, Banbridge and Craigavon to £165,294 in Lisburn and Castlereagh.