Peace is key to prosperity

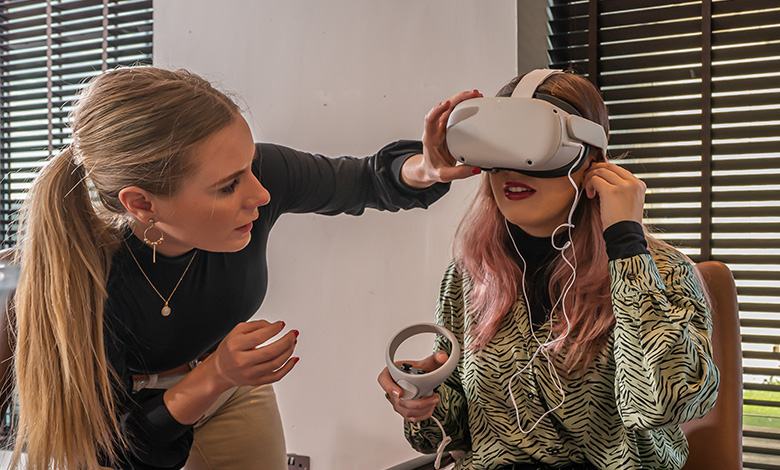
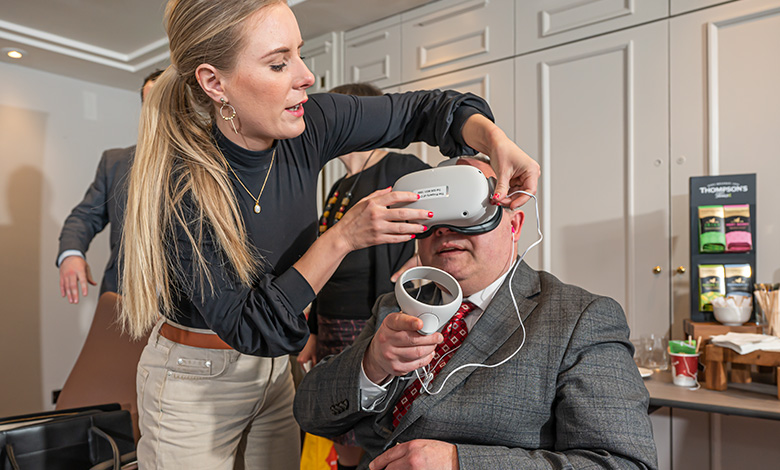
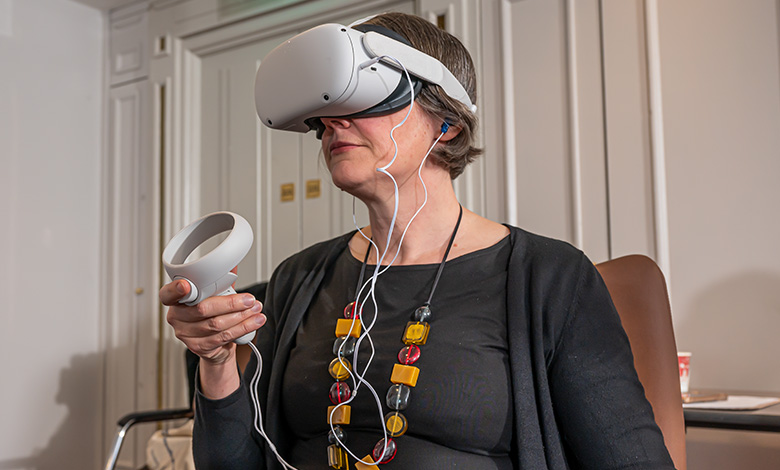
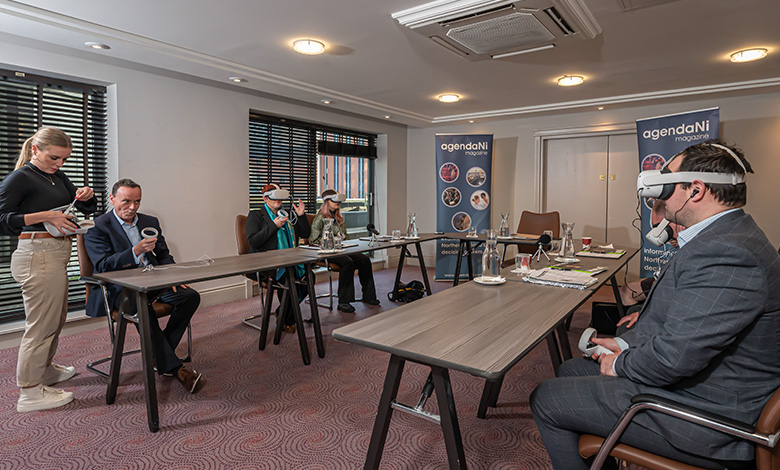
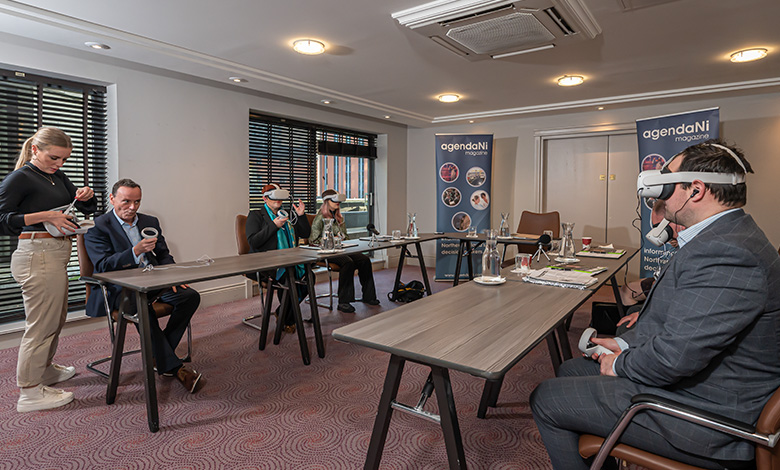
The Commission for Victims and Survivors (CVSNI) hosted a round table discussion with key stakeholders on the topic of peace as the key to prosperity. Prior to the discussion, guests took part in a virtual reality experience called ‘The House’, a thought-provoking and reflective piece regarding the ongoing social issues as a result of being a post-conflict society and what can be done to address these.
Round table discussion hosted by

Does learning from Northern Ireland’s past have a role in shaping its future?
Emma Murphy
As someone born in 1999, a year after the Good Friday Agreement (GFA), peacetime is normal to my generation. It is the standard that we expect. I do not have my own personal experience of ‘the Troubles’, but I can see how it affects the present and the future. We consistently see the political implications of legacy issues and on the functionality of government. Those issues of the past impact the present and the future.
Ian Jeffers
Learning from the past is critical because we cannot look forward if we do not look back. Last year – 2022 – is a prime example of why that is important. We witnessed multiple incidents of casual sectarianism, through songs and chants, which were carried out without an understanding of the impact that they would have on individuals, as victims and survivors, or on complete communities. As a society, we are in a much better place since the Good Friday Agreement, and we should be positive about that but there is much work still to do. We need to understand the past as a collective, rather than through our old tribal approach.
Ann Watt
Pivotal published research that provided an overview of the key factors associated with the educational migration of students from Northern Ireland to Great Britain, but also surveyed their rationale for doing so. The major factors identified were economic in nature, including wider course diversity and better job opportunities. However, students also very clearly stated that they left Northern Ireland because of the continued societal division and the emphasis on identity. In the VR experience, a young male teacher makes the point to his mother that he wants to go somewhere that he is not asked where he is from and what school he went to. That relates to our research because young people were clear that one of their reasons for leaving was the constant ‘identity check’ which occurs here, where people are always wondering what someone’s community background is. A further reason was dysfunctional government. That was a reference to the present, but there is a clear link between how we have dealt with the past and how government is failing to represent the issues that matter to young people today.
Graham Brownlow
There is an economic concept called path dependence, which infers that unemployment yesterday makes unemployment today more likely; and unemployment today makes unemployment tomorrow more likely. Path dependence matters. If I assess the three most important challenges to the Northern Ireland economy today: low productivity; high labour market inactivity; and not enough of the right type of investment, they can all be traced through history. However, it is worth noting that many of these problems are also traceable to pre-Troubles. ‘The Troubles’ is sometimes used as an all-purpose excuse for the Northern Ireland economy, and it is not. While ‘the Troubles’ damaged and distorted the economy, it had plenty of problems prior to that.
Round table participants
The transgenerational impact of the past is often focused on in terms of trauma. But what influence does the past have on our current economic and societal landscape?
Graham Brownlow
Northern Ireland’s labour market inactivity rates have been consistently higher than Great Britain’s for the past 30 years. There is constant debate among economists as to what extent that long-term unemployment challenge of the ‘70s and ‘80s has evolved into the current challenge of inactivity. There are identifiable ways in which the past has shaped inactivity in Northern Ireland. For example, Declan French and Sharon Cruise in their work Disability and the Northern Irish Troubles, found that ‘the Troubles’ accounted for a 28 per cent rise in work-related disability in Northern Ireland. Putting a figure on it, they estimate an economic cost of £7 billion due to work disability. Given our current weak public finances, it is hard to see how the absence of an extra £7 billion, a healthier population, and subsequent increased tax revenue has not had an impact on public finances.
“That we are still segregated in our schools, our sports, and socially reinforces the fact that we have not moved one step forward with reconciliation.” Ian Jeffers
Ian Jeffers
It is very clear that we still have communities living in the shadows of the conflict. The same wards appear at the top of the league tables for deprivation time and time again. We have areas with totally different prospects and life chances just a stone’s throw away from each other. Some might say that deprivation disparity exists in other countries too, but the fact is that we have an underlying challenge of the legacy of the conflict, which we have failed to address. As a result, we are in a spiral where we cannot keep the talent that we have. Young people want to leave home but unlike other regions, a disproportionate number never come back.
Ann Watt
It is irritating to hear politicians sometimes dismiss the brain drain challenge that exists here as a general challenge, which also exists across the likes of England and Scotland. Our challenge is unique because not only do people not come back but we do not have an inflow of people to replace them. Our research tells us that young people that left were able to evaluate their upbringing here and come to the conclusion that it was unusual to live in such a divided place. Growing up here it was normal for schools, social groups, and sports to be divided; but after experiencing places where there was no ‘identity check’, they did not want to return to being put in a box.
Graham Brownlow
As someone who did his first degree outside of Northern Ireland, I see it as totally natural for people to leave and go where best fits them and their studies. However, I also believe that Northern Ireland should be an attractive place to return to if the will is there. The danger for Northern Ireland is we create an economic model where people cannot return.
The opportunity for dialogue around shared experiences between communities is extremely limited.”
Emma Murphy
The fact that education is not integrated perpetuates a system of division and disparity. My lived experience is that when people from Northern Ireland go to university in Northern Ireland, they tend to stay in those same groups. That is an impact of the past on today’s society.
What role does multi-generational learning and the inclusion of children and young people on victims’ issues have in delivering a better future?
Ian Jeffers
We have limited teaching about ‘the Troubles’ in our schools, for various reasons, but the outcome is that many young people today do not fully understand why we have a divided society. By the same token, disparity in our communities means that even for those who grew up during ‘the Troubles’, their stories are very different. That we are still segregated in our schools, our sports, and socially reinforces the fact that we have not moved one step forward with reconciliation. Our young people, who have experienced a relatively peaceful Northern Ireland, are the ones to lead that mature conversation and discuss our shared experiences as a society.
Emma Murphy
My experience is that because of the limitations of teaching within schools, much of the learning around ‘the Troubles’ is oral history within families. That in itself raises challenges because there is no consensus. You may have someone with a distorted view, levels of overexposure or, in some cases even, under exposure, where trauma closes doors and prevents inter-generational conversation. The opportunity for dialogue around shared experiences between communities is extremely limited. That extends beyond here. My experience is that young people in the South or in England have a complete lack of understanding. However, I would say that for current generations, background is no longer as important, and that ‘identity check’ is happening less. That builds on the frustration around politics today because entrenched politics are not reflective of progression within society.
Ian Jeffers
Undoubtedly, our society is better for the levels of integration that now exist. However, we must be cognisant of the fact that there are still no-go areas in certain communities and there is still division. We must create an environment where people can have a mature and honest conversation about the past, in a safe space. Our research would suggest that young people are thirsty for information about the past and they want to hear it from all sides of the community. Unlike other post-conflict societies, like South Africa, we do not have a model for reconciliation, and we have not actually addressed the legacy of the past. Until we address that, we cannot move forward with prosperity.
Graham Brownlow
In other societies, they drew a line. Take Germany for example, there were symbols and actions that were deemed unacceptable and that remains the case today. We have yet to do that. Just as ‘the Troubles’ cannot be an all-purpose excuse for our current challenges, the GFA should not be viewed as an all-knowing solution. It was designed to be built upon. Issues like legacy were deliberately fudged and some issues we face today, like Brexit for example, could not have been envisaged. I think part of the problem is that we continue to try and improvise on that consensus reached in 1998, rather than build a shared consensus for society today.
Ann Watt
The GFA opens with a declaration of support from all the signatories and, while reading it recently, it struck me just how far those leaders were stretching themselves, and equally, how that spirit appears to be lost today. For example, it states: “We acknowledge the substantial differences between our continuing, and equally legitimate political aspirations. However, we will endeavour to strive in every practical way towards reconciliation and rapprochement within the framework of democratic and agreed arrangements. We pledge that we will, in good faith, work to ensure the success of each and every one of the arrangements to be established under this agreement.” If you look at our political situation and our political leadership, that spirit has been diluted down over the years and I do not know if we are willing to do the difficult things.
What are the barriers or opportunities to furthering economic prosperity in Northern Ireland?
Graham Brownlow
There are the obvious proximate issues we have alluded to such as productivity, inactivity, and mal-investment, but if we look at economic history in the long term, there are three ultimate sources of problems. It is worth noting that an overarching problem is an inability to correctly diagnose and mitigate these three problems. Firstly, Northern Ireland shares UK-wide economic challenges. Secondly, Northern Ireland has magnified versions of UK problems. Thirdly, Northern Ireland has unique challenges because of its past, not least partition, violence, and trauma. The reality is that there is no single lever to solve these problems. We can debate the merit of each, but we have yet to form a solution that addresses all.
Emma Murphy
From a young person’s perspective, there is an imbalance in our public and private sectors, with opportunities in the private sector for those leaving education limited in comparison to other countries. The threat of not being accommodated in the labour market is driving the brain drain. There is also a challenge around regionality, with many career prospects concentrated in geography and specific industries. A plurality of options is key to attracting and retaining talent. An opportunity exists to grow our young population over the next decade, but we must do the groundwork if we want that to happen be that around infrastructure, transport, or accommodation availability.
“Most of our young people are getting their education about the past from family and communities, and there is significant variation in our formal education approach.”
Ann Watt
Ann Watt
The greatest barrier to economic growth is stability, particularly political stability. Any investors will tell you the importance of stability and of government-driven plans to deliver a workforce, infrastructure etcetera. Not only do we not have that long-term plan, but we do not have a government. The legacy of ‘the Troubles’ is apparent in so much of our economy from our transport systems and travel patterns, through to our built environment. Addressing climate change is both a huge challenge and a huge opportunity. We are already behind the curve, but our size, our geography, and the generational shift in attitudes is fertile ground for an ambitious green agenda.
From your own perspective, what are the priority policy levers or areas of focus for contributing to a better future?
Graham Brownlow
The challenges are manifold and so the solutions must also be manifold. However, an area of priority should be education and human capital, in particular in the pre-school age bracket. Nobel laureate Jim Heckman won his prize in part for research which highlighted how pre-school education not only improves opportunity and aspiration, but creates better education, health, social and economic outcomes for society and reduces the required need for social spending.
Ann Watt
I agree that early education is key but would add that such education should be integrated. Most of our young people are getting their education about the past from family and communities, and there is significant variation in our formal education approach. That is not helped by a segregated education system. We need to do much more to bring our young people together, on a permanent basis.
Emma Murphy
I would argue that more important than the policy is the willingness to implement change. New Decade, New Approach was welcomed with hope, but it has fallen down on many of its promises and as a result, people have become disillusioned. Even the greatest policy needs to be backed up with implementation and progress.
“The danger for Northern Ireland is we create an economic model where people cannot return.”
Graham Brownlow
Ian Jeffers
Underpinning policy for the future must be the understanding that it is right for our young people. Policymakers must look into the eyes of our youngest generations and ensure that any action taken is based on their future. Only then will we be able to start shaping the future we all want.

