Richard Tol discusses the Northern Ireland Energy Model (NiEMO) with Peter Cheney and the need for better data on the province’s energy use.
Northern Ireland’s first energy model will be published shortly, following on from research by a team led by Richard Tol, a research professor at the Economic and Social Research Institute in Dublin. Tol, who also works at Trinity College Dublin and Amsterdam’s Vrije Universiteit, outlined the main identified trends to an agendaNi seminar on energy infrastructure in March. The research was funded by the Strategic Investment Board.
Final energy use data for 2006 indicate that Northern Ireland’s total usage in 2006 was nearly 5Mtoe, of which nearly half was domestic. The second largest bloc (approximately 2Mtoe) was for transport, storage and communication, but principally transport. The next two (electricity, gas and water supply, and agriculture) were much smaller in comparison, less than 0.5Mtoe.
Energy use is therefore strongly defined by where people live and how they travel.
Not surprisingly, transport, storage and communication was by far the most energy-intense sector. Energy intensity approaches 1.2kg of oil equivalent per pound sterling, followed at a distance by agriculture and forestry (just under 0.4kg). The least intense sectors are financial intermediation, wholesale and retail trade, real estate, renting and business activities.
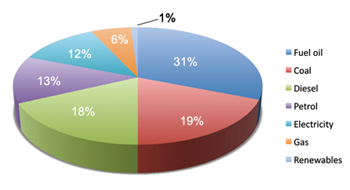
Northern Ireland has a fairly unique energy mix (see chart) with high shares for fuel oil, diesel and coal. This reflects the province’s limited public transport network, large public sector and economically inactive population and the shortage of heavy industry.
Estimates for carbon dioxide emissions by sector are already available at UK and Republic of Ireland levels. The three highest emitting sectors in each country were:
• electricity, gas and water supply (first in both countries);
• transport, storage and communication (second in the UK);
• domestic (second in the Republic).
In both cases, electricity, gas and water supply mostly covered refining. No specific data are available for Northern Ireland.
Background factors included in the model included Northern Ireland’s economic growth rate (predicted by Oxford Economics), world oil prices from the International Energy Agency and demographic patterns.
Northern Ireland is currently a net exporter in power generation but, on the baseline scenario, will become a net importer after the second North/South interconnector is built. Progress towards 40 per cent renewables by 2020 would see the province returning to export status after 2020.
Coal will cease to be used for power generation by 2014, according to the baseline, but the 40 per cent scenario foresees that continuing well into the future for co-firing biomass.
Cutting carbon
A gas pipeline to the west would bring about a small reduction in carbon emissions; this assumes a 30 per cent uptake in the households that will be reached.
Insulating buildings would bring greater benefits. Without intervention, the percentage of ‘below standard’ houses will fall from 26 per cent in 2006 to 20 per cent in 2025 i.e. down to 12,412 thousand tonnes of CO2. However, increasing heat efficiency by 30 per cent could achieve 12,364 thousand tonnes by 2020 and 12,226 by 2025.
One scenario looks at the potential impact of 10 per cent of commuters changing to walking, cycling or taking the bus. However, this would only decrease the 2025 figure for carbon emissions from 12,412 to 12,396 thousand tonnes. The normal commute in Northern Ireland is short (8-9 miles) and commuting only accounts for 20 per cent of the total population’s travel, as so many people are not working.
The model copies the same structure used in the ESRI’s energy model for the Republic, developed over the past five years.
“It’s essentially an econometric simulation model so we project energy use by sector based on economic forecasts of how the sectors will develop,” he told agendaNi afterwards. “And then the energy use in those sectors depends on the structure of the economy, how fast the economy grows, which sectors grow fast [and] the price of energy obviously.”
Its main purpose is to compare different scenarios, which will make it particularly relevant to policy-makers. The key questions will be what they can do to change the assumptions used in the baseline and what effect that will have on energy use: “So it’s essentially an exploratory tool for energy use [and] for carbon dioxide emissions.”
However, reducing emissions further will be a hard task as Northern Ireland’s two dominant sources for emissions (i.e. transport and households) are also the most difficult to change.
In drawing up the model, Tol did the best he could with the data he could find, but the shortage of information was disappointing. “There’s big black holes in data availability,” he comments. “Some data simply aren’t there. Some data, while they are there, are not accessible.”
That problem was caused by a “very secretive” public sector working in “silos, and not talking to each other and not communicating” and also a “certain amount of neglect” from the UK Government. Northern Ireland is “not something that is high on the list of priorities for the people who collect the official statistics for what they call the UK, but in effect is Great Britain.”
Northern Ireland’s Fuel Mix (5)